
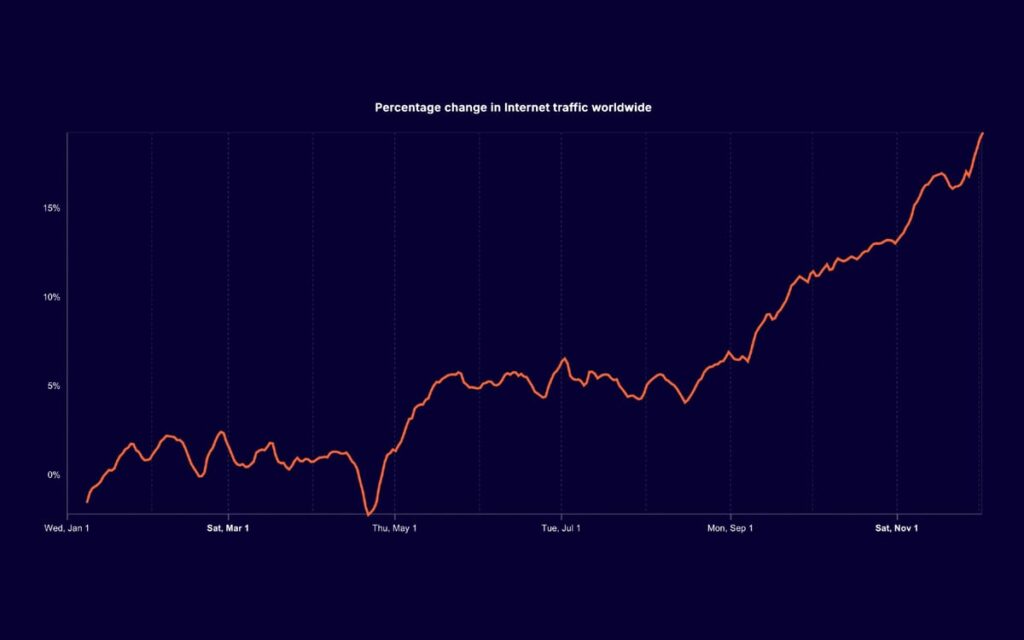
Global internet traffic grew by 19% in 2025, with artificial intelligence crawlers making up 4.2% of all HTML requests on Cloudflare’s network, as noted in their annual Year in Review report. The report analyzed trends across the company’s global infrastructure.
AI bot activity significantly altered the composition of internet traffic. Human users were responsible for 43.5% of HTML requests, while non-AI automated systems accounted for 47.9%. GoogleBot, which is used for search indexing and AI model training, made up 4.5% of the requests, but it was not classified as an AI bot due to its multiple functions.
Most AI crawlers were focused primarily on training, with this activity far exceeding search-related crawling and user-directed actions over the year. These bots accessed content to enhance conversational platform capabilities and assist in retrieval-augmented generation systems. Similarly, user action bots gathered web content based on tasks dictated by human users through AI platforms.
The traffic data showed concentrations among major AI operators, with GPTBot from OpenAI, ClaudeBot from Anthropic, and Meta-ExternalAgent from Meta registering high traffic volumes. Other significant AI crawlers included Bytespider from ByteDance, Amazonbot from Amazon, and Applebot from Apple. Traditional search engine crawlers like GoogleBot and BingBot maintained higher traffic levels than specialized AI training systems.
Cloudflare evaluated robots.txt files from 3,879 of the top 10,000 domains to assess how website operators managed AI crawler access. The analysis categorized responses as fully allowed when a wildcard character was present, fully disallowed when all paths were blocked, or partially allowed/disallowed when specific paths had different permissions. Results indicated varied strategies among website operators.
The crawl-to-refer ratio compared requests from platform-owned bots to referral traffic from those platforms back to websites. Anthropic, OpenAI, and Perplexity reported ratios ranging from 10:1 to over 100:1, suggesting these platforms crawled much more content than they referred to source websites. Microsoft, Google, and ByteDance exhibited different ratios reflecting their unique platform dynamics.
Security measures mitigated 6.2% of global traffic in 2025, with DDoS mitigation and Web Application Firewall rules addressing 3.3% of traffic. The gaming and gambling sectors saw the highest targeting rates among various industries, according to weekly aggregated data.
Network-layer DDoS attacks reached peak sizes of 31 terabits per second in 2025, indicating a tenfold increase from the previous year. Packet-based attack sizes grew more than sevenfold. Cloudflare defines hyper-volumetric attacks as those exceeding one terabit per second or one billion packets per second at Layers 3 and 4 of the network stack.
The adoption of post-quantum encryption increased dramatically throughout the year. By November, 52% of TLS 1.3 traffic utilized post-quantum key agreement methods designed to secure encrypted data against future quantum computing capabilities. Cloudflare had enabled this method on its network by default in October 2022, but widespread adoption required browser support, which surged as major browsers adopted these techniques.
Resource Public Key Infrastructure (RPKI) adoption made steady progress in both IPv4 and IPv6 address spaces. RPKI-valid IPv4 routes reached 53.9% by the year’s end, up 3.9 percentage points from 2024, while IPv6 adoption rates hit 60.1%. RPKI offers cryptographic methods for validating BGP route announcements, helping network providers reject invalid routes.
Traffic growth calculations deliberately excluded early January to normalize activity following the holiday season. The overall 19% increase indicated ongoing global reliance on internet connectivity for various applications, including communication and commerce. Traffic measurements were based on aggregate request volumes from Cloudflare’s infrastructure, which services millions of websites and applications.
SpaceX’s Starlink satellite internet service experienced a 2.3x growth in traffic in 2025, particularly in underserved areas. Cloudflare analyzed traffic volumes from locations with Starlink connectivity, indicating limited service availability.
Established internet services maintained their hierarchy, with Google remaining the most popular globally, followed by Facebook and Apple. Instagram entered the top ten rankings in 2025, alongside YouTube. WhatsApp broke into the global top ten for the first time, while TikTok remained a top player.
Generative AI platforms also continued to expand. Claude, Perplexity, and Gemini emerged as primary competitors to ChatGPT in the conversational AI space, with their rankings based on data from Cloudflare’s 1.1.1.1 DNS resolver service.
Engagement patterns on social media platforms shifted. After Facebook, Instagram, and TikTok, Snapchat outperformed X (formerly Twitter) in traffic measurements. Roblox maintained its lead in the metaverse and gaming categories, despite facing competition.
Mobile device traffic accounted for 43% of global requests, with desktop systems generating 57%. A total of 117 countries showed majority traffic from mobile devices, with Android leading at 65% of mobile traffic globally compared to iOS’s 35%. In some regions, Android adoption reached 97%, while iOS peaked at 70% in wealthier markets.
The adoption of the HTTP protocol continued, with HTTP/3 usage at 21% of global requests and HTTP/2 at 50%. Legacy HTTP/1.x versions represented 29% of traffic. The use of the QUIC transport protocol in HTTP/3 enables faster connections and improved packet loss handling.
IPv6 adoption increased to 29% of dual-stack traffic during 2025. This analysis accounted for requests over both IPv4 and IPv6, underscoring limited IPv4 address space availability, which prompted some cloud providers to charge for IPv4 usage, thereby accelerating the transition to IPv6.
Browser market share indicated Chrome held 66.2% globally, followed by Safari at 15.4%, Edge at 7.4%, Firefox at 3.7%, and Samsung Internet at 2.3%. In the search engine market, Google dominated at 89.5%, with Bing at 3.1%, Yandex at 2%, Baidu at 1.4%, and DuckDuckGo at 1.2%.
Internet outages affected global connectivity 174 times in 2025, with government-directed shutdowns causing the most significant disruptions, totaling 83 incidents. Power outages led to 25 disruptions, and cable cuts caused 19 incidents.
Analysis of email security revealed that an average of 5.6% of messages were classified as malicious throughout the year. Deceptive links were found in 52% of malicious emails, while identity deception affected 38.3%, and brand impersonation appeared in 32.3% of cases.
Patterns of abuse among top-level domains identified .christmas as producing the highest share of malicious and spam emails among nearly 1,600 TLDs tracked. Other frequently exploited domains included .lol, .forum, .help, and others.
Bot traffic was primarily concentrated in the top ten countries, with the United States generating 40% of global bot traffic, followed by Germany at 6.5% and Singapore at 4.1%. China, India, the United Kingdom, the Russian Federation, and Brazil rounded out the top ten.
Significant bot traffic concentrations were observed among cloud platform providers. Amazon’s AS16509 produced 9.2% of global bot traffic, while Microsoft’s AS8075 accounted for 5.5%. Other contributors included Amazon’s AS14618, Google’s AS15169, and Cloudflare’s AS13335.
Internet quality measurements revealed Spain having the highest median download speed at 318 Mbps, followed by Hungary and Portugal. Measurements relied on user-initiated speed tests across 2025.
Geographical data showed the London area with the most significant volume of speed tests, alongside high activity in the United States, Hong Kong, and Japan.
Website technology analysis of the top 5,000 domains showed Google Analytics with a 37% adoption rate, followed by Facebook Pixel and LinkedIn Insight Tag.
Analysis of API client development indicated Go as the most popular programming language, covering 20% of automated API traffic. Other notable languages included Python, Java, Node.js, and .NET.
In terms of SDK usage, the @cf/meta/llama-3-8b-instruct model was the most widely adopted, followed by @cf/openai/whisper and @cf/microsoft/resnet-50.
The comprehensive report from Cloudflare illustrates the traffic trends, security threats, and technological advancements shaping the internet landscape in 2025. It provides valuable insights to stakeholders across various sectors regarding the current state of internet usage and emerging challenges.
—